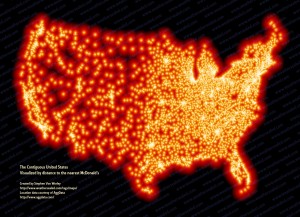
直近のマクドナルドからの距離(as the crow flies)に比例して色付けされた全米マップ:
McDonald’s. Yes, They Really Are Everywhere | GeekDad | Wired.com
こういうマップを自動的に作ってくれるソフト・サービスを作れば結構面白いかなと思う。もちろんArcGISとか使えばできるけど敷居が高すぎる(ライセンスも厳しすぎる)。住所ないし座標のリストをインプットして描画する地図の種類、それに色彩などの設定ができれば十分。多少不正確にはなるだろうけど、Google Mapの外部APIを使えば割合簡単にできるだろう。

すごいですね〜 私はvisualな人なのでこういうvisualizationできるマップを見るのが結構好きです。
It’s interesting how dense it is on the Eastern half of the US, and rather sparse in California… maybe because people are more health-conscious out here?
最近visualizationには注目してます。
The reason why they are more dense in the east is, most likely, just that population is more dense there 🙁 Please take a look at the graph of population density in the U.S. on the latest post.
ピンバック: アメリカの人口密度 » Rion's Blog